<?xml version="1.0" encoding="utf-8"?><feed xmlns="http://www.w3.org/2005/Atom" ><generator uri="https://jekyllrb.com/" version="3.10.0">Jekyll</generator><link href="https://napla-dev.github.io/feed.xml" rel="self" type="application/atom+xml" /><link href="https://napla-dev.github.io/" rel="alternate" type="text/html" /><updated>2026-10-12T16:08:45+00:00</updated><id>https://napla-dev.github.io/feed.xml</id><title type="html">napla-dev</title><subtitle>Football analytics notes on tracking data and defensive play.</subtitle><author><name>napla-dev</name></author><entry><title type="html">Six Runs and a Blind Spot: Off-Ball Movement Through xMark</title><link href="https://napla-dev.github.io/2026/10/six-runs-and-a-blind-spot/" rel="alternate" type="text/html" title="Six Runs and a Blind Spot: Off-Ball Movement Through xMark" /><published>2026-10-06T00:00:00+00:00</published><updated>2026-10-06T00:00:00+00:00</updated><id>https://napla-dev.github.io/2026/10/six-runs-and-a-blind-spot</id><content type="html" xml:base="https://napla-dev.github.io/2026/10/six-runs-and-a-blind-spot/"><![CDATA[<p><em>Six scenes · 49 World Cup matches · PFF FC open tracking data</em></p>

<blockquote>
  <p><strong>TL;DR</strong>
- xMark can’t grade an off-ball run, but it can show how one works: which defender moved, and who that freed. I use the model from <a href="/2026/09/getting-free-doesnt-get-you-the-ball/">an earlier post</a> to follow who is marking whom, frame by frame.
- Two patterns show up clearly: a run that <strong>pulls a defender off a teammate</strong>, and a run that <strong>shakes off a marker</strong>.
- One kind of run doesn’t: an attacker who is clearly free but still has a defender chasing a couple of metres behind. Pitch control misses it too.</p>
</blockquote>

<h2 id="what-im-looking-at">1. What I’m looking at</h2>

<p>Off-ball runs are one of the hardest things to measure. A run can be excellent and never touch the ball, or create space that a teammate uses.</p>

<p>In an <a href="/2026/09/getting-free-doesnt-get-you-the-ball/">earlier post</a> I built a model from tracking data. In brief, for every attacker \(j\) and defender \(i\) in every frame:</p>

\[T_{ij} = \tau_r + \frac{\lVert (\mathbf r_j + \mathbf v_j \Delta) - (\mathbf r_i + \mathbf v_i \tau_r) \rVert}{v_{\max}}, \qquad
p_{ij} = \frac{1}{1 + \exp\!\left( -\dfrac{\pi}{\sqrt{3}\,\sigma}\,(T - T_{ij}) \right)}\]

<p>\(T_{ij}\) is the time defender \(i\) needs to reach where attacker \(j\) will be in \(\Delta = 1\) s (reaction time \(\tau_r = 0.7\) s, then running at \(v_{\max} = 5\) m/s), and \(p_{ij}\) turns it into the probability that he gets there within \(T = 1.5\) s (\(\sigma = 0.45\) s). These steps follow Joris Bekkers’ Pressing Intensity (2025); what the earlier post added is the breakdown by defender and a check against human labels. From these come the two quantities used here:</p>

\[P_j = 1 - \prod_i (1 - p_{ij}), \qquad m_{ij} = P_j - P_j^{(-i)}\]

<ul>
  <li><strong>xMark</strong> \(P_j\): the probability that at least one defender can reach attacker \(j\) in time. Close to 1 means marked; close to 0 means free. Strictly, it measures reach, not whether a defender is actually marking him; Section 5 shows why that matters.</li>
  <li><strong>Marker contribution</strong> \(m_{ij}\): how much attacker \(j\)’s xMark falls if defender \(i\) is removed. The defender with the largest \(m_{ij}\) is, in the model’s view, the one marking \(j\). Checked against human analysts, it identifies the defender who pressed the receiver slightly better than a “nearest defender” rule does.</li>
</ul>

<p>That post found xMark to be a poor predictor of danger. Here I use it for something else: describing what happens during a run.</p>

<h2 id="how-to-read-the-clips">2. How to read the clips</h2>

<ul>
  <li><strong>Left: the pitch.</strong> Attackers are white, defenders black. The ring around each attacker shows their xMark (purple = free, yellow = marked). A line joins each defender to the attacker he is marking, thicker when \(m_{ij}\) is larger.</li>
  <li><strong>Background: pitch control.</strong> Red where the attacking team would win the ball if it were played there, blue where the defence would (Spearman’s physics-based model).</li>
  <li><strong>Right: the numbers.</strong> Solid lines are xMark of the two attackers involved. Dashed lines are one defender’s marker contribution to each of them. Lines break while a player has the ball, because xMark is only computed for players without it.</li>
</ul>

<h2 id="pattern-one-pulling-a-defender-off-a-teammate">3. Pattern one: pulling a defender off a teammate</h2>

<p>In these three scenes, one attacker’s run draws a defender away, and a teammate’s xMark drops as a result.</p>

<h3 id="case-1-two-runners-one-defender-france-v-poland-2808">Case 1: Two runners, one defender (France v Poland, 28:08)</h3>

<figure>
  <video src="/assets/video/offball/01_FRA-POL.mp4" autoplay="" loop="" muted="" playsinline="" style="width:100%"></video>
</figure>

<p>Giroud and Rabiot both run into the area Kamil Glik is defending. Just before the reference point, Glik’s contribution to the two of them is almost equal (about 0.7 each): he is effectively responsible for both at once. The dashed lines cross 0.1 s before the reference point. From there he goes with Rabiot (contribution 0.11 at 1.9 s before the reference point → 0.84 at 1.2 s after) and lets Giroud go (0.82 at 0.7 s before → 0.38 at 1.1 s after). Giroud’s xMark halves, from 0.80 to 0.40. Dembélé’s cross finds Giroud, whose shot goes wide.</p>

<p>Whether the two runs were planned together, the data can’t say, but the result is a 2-v-1 on a centre-back, who has to choose one of the two.</p>

<h3 id="case-2-a-diagonal-run-opens-the-space-portugal-v-switzerland-3455">Case 2: A diagonal run opens the space (Portugal v Switzerland, 34:55)</h3>

<figure>
  <video src="/assets/video/offball/02_POR-SUI.mp4" autoplay="" loop="" muted="" playsinline="" style="width:100%"></video>
</figure>

<p>Guerreiro makes a diagonal run across the box. Granit Xhaka drifts towards it and stops covering Gonçalo Ramos (contribution 0.45 → 0.02). Ramos runs into the space, and his xMark falls from 0.94 to 0.08: the largest drop, weighted by how dangerous his position was, of any candidate I found. Félix’s cross reaches him, but he is challenged and the ball goes out.</p>

<p>Xhaka never fully picks up Guerreiro (his contribution to him only reaches 0.21), yet his movement is enough to free Ramos.</p>

<h3 id="case-3-attacking-the-box-to-free-the-striker-croatia-v-canada-7102">Case 3: Attacking the box to free the striker (Croatia v Canada, 71:02)</h3>

<figure>
  <video src="/assets/video/offball/03_CRO-CAN.mp4" autoplay="" loop="" muted="" playsinline="" style="width:100%"></video>
</figure>

<p>Kramarić runs into the box, and Steven Vitória switches from Petković to him (contribution to Kramarić 0 → 0.67, to Petković 0.49 → 0.18). Petković’s xMark falls from 0.69 to 0.30. Here the ball goes to the runner: Kramarić shoots, wide.</p>

<h2 id="pattern-two-shaking-off-a-marker">4. Pattern two: shaking off a marker</h2>

<p>The simpler version: an attacker loses the defender who was marking him.</p>

<h3 id="case-4-nez-in-the-box-ghana-v-uruguay-0810">Case 4: Núñez in the box (Ghana v Uruguay, 08:10)</h3>

<figure>
  <video src="/assets/video/offball/04_GHA-URU.mp4" autoplay="" loop="" muted="" playsinline="" style="width:100%"></video>
</figure>

<p>Darwin Núñez’s xMark falls from 0.70 to 0.16 in 0.8 seconds, as Daniel Amartey’s contribution drops by the same amount. Núñez is free in the box, but the cut-back doesn’t reach him.</p>

<h3 id="case-5-a-late-run-from-midfield-cameroon-v-brazil-907">Case 5: A late run from midfield (Cameroon v Brazil, 90+7)</h3>

<figure>
  <video src="/assets/video/offball/05_CAM-BRA.mp4" autoplay="" loop="" muted="" playsinline="" style="width:100%"></video>
</figure>

<p>Fabinho arrives from the second line. Collins Fai follows him at first, then loses him (contribution 0.58 → 0.11), and Fabinho’s xMark drops from 0.67 to 0.19. The chance goes to Martinelli, who shoots wide.</p>

<h2 id="what-the-model-cant-see">5. What the model can’t see</h2>

<h3 id="case-6-weah-usa-v-wales-3510">Case 6: Weah (USA v Wales, 35:10)</h3>

<figure>
  <video src="/assets/video/offball/06_USA-WAL.mp4" autoplay="" loop="" muted="" playsinline="" style="width:100%"></video>
</figure>

<p>On video, this is a clean run in behind: Weah gets goal-side of Neco Williams, Pulisic plays him through, and Weah scores first time.</p>

<p><strong>The model misses this run: Weah’s xMark is still 0.57 when he receives the ball, because a beaten defender two metres behind still counts as able to reach him.</strong> His xMark falls from 0.96 to 0.58 by the time the pass is played. When the pass is played, Williams is level with Weah; Weah is faster (7.5 against 6.7 m/s) and gets goal-side while the ball is rolling, so by the time he receives it Williams is about two metres behind, still chasing. The model asks only whether a defender <em>can reach</em> the attacker, not whether he is goal-side of him. (For this clip I keep computing Weah’s xMark after he receives the ball; normally it stops.)</p>

<p>Pitch control doesn’t spot it either. Around Weah the background is actually blue: attacking pitch control at his position is 0.24 when the pass is played and 0.25 when he receives it. It also asks who can get there first, and by that measure Williams can.</p>

<p>This is a limit of the whole family of “who can reach it first” models, not just mine. Fixing it would need something that knows which way the defender is facing and which side of the attacker he is on.</p>

<h2 id="how-xmark-relates-to-pitch-control">6. How xMark relates to pitch control</h2>

<p>The two are built from the same pieces. Both estimate how long each player needs to reach a point (reaction time plus running at top speed) and turn that into a probability. The differences:</p>

<table>
  <thead>
    <tr>
      <th> </th>
      <th>Pitch control</th>
      <th>xMark</th>
    </tr>
  </thead>
  <tbody>
    <tr>
      <td>Where</td>
      <td>Every point on the pitch</td>
      <td>Only where each attacker is heading</td>
    </tr>
    <tr>
      <td>Who</td>
      <td>Attack against defence</td>
      <td>Defence only</td>
    </tr>
    <tr>
      <td>Breaks down into</td>
      <td>Who controls each point</td>
      <td>Who is marking each attacker</td>
    </tr>
  </tbody>
</table>

<p>To see how closely they agree, I took 50,000 random frames of attackers without the ball from all 49 matches and compared an attacker’s freedom (\(1 - P_j\)) with attacking pitch control at his position.</p>

<table>
  <thead>
    <tr>
      <th>Where the attacker is</th>
      <th>Frames</th>
      <th>Rank correlation [95% CI]</th>
    </tr>
  </thead>
  <tbody>
    <tr>
      <td>Everywhere</td>
      <td>50,000</td>
      <td>0.76 [0.74, 0.77]</td>
    </tr>
    <tr>
      <td>Middle third</td>
      <td>27,589</td>
      <td>0.76 [0.75, 0.77]</td>
    </tr>
    <tr>
      <td>Final third, outside the box</td>
      <td>18,880</td>
      <td>0.67 [0.65, 0.68]</td>
    </tr>
    <tr>
      <td>Inside the penalty area</td>
      <td>2,691</td>
      <td>0.51 [0.47, 0.55]</td>
    </tr>
  </tbody>
</table>

<p><strong>The closer to goal, the less xMark and pitch control agree: rank correlation 0.76 overall, but 0.51 inside the penalty area.</strong> Inside the box, the average attacker is mostly covered (freedom 0.25) while pitch control at his position is roughly even (0.53).</p>

<p>The disagreements also go one way. Here “free” means an xMark of 0.2 or less, and “covered” more than 0.8. An attacker xMark calls free almost always stands in space his team controls: only 1.3% of all frames are “free but in the defence’s space”. The reverse is common: more than half of the attackers it calls covered are standing where pitch control favours the attack (9.6% of all frames). That is what you’d expect in crowded areas: a defender is close enough to one attacker to cover him, but other attackers are close enough to the same spot to win a ball played there.</p>

<p>So the two are not interchangeable, especially in the box, where most of these scenes happen. xMark is not a better pitch control. Its use is the last row of the table: it says who is marking whom, which a pitch control map doesn’t show directly.</p>

<h2 id="how-these-scenes-were-chosen">7. How these scenes were chosen</h2>

<p>I didn’t pick these by hand from memory. I searched all 49 matches for two patterns during open play in the opponent’s half, with the attacker moving towards goal:</p>

<table>
  <thead>
    <tr>
      <th>Pattern</th>
      <th>Per match</th>
      <th>Shot within 5 s</th>
    </tr>
  </thead>
  <tbody>
    <tr>
      <td>A defender switches from one attacker to another, and the first attacker’s xMark drops by 0.3 or more within 2 s¹</td>
      <td>8.5</td>
      <td>9.1%</td>
    </tr>
    <tr>
      <td>An attacker’s xMark drops from above 0.5 to below 0.2 within 2 s, at a position worth at least 0.05 xG</td>
      <td>1.1 (52 in total)</td>
      <td>15.4% (8 of 52)</td>
    </tr>
    <tr>
      <td>Any moment under the same conditions</td>
      <td>—</td>
      <td>5.0%</td>
    </tr>
  </tbody>
</table>

<p>¹ Excluding switches that happen in the same frame as a change of ball carrier (which reshuffles the model’s assignments mechanically), and switches where the defender’s contribution is below 0.05 before or after.</p>

<p>Both patterns are followed by shots more often than a random moment, though this is an association, not proof that the run caused the shot. From the top candidates I watched the footage and kept the scenes where the run was clear on video and the numbers told the same story. I dropped scenes where the defender’s contribution was too small (below about 0.2) to say that his movement freed anyone.</p>

<h2 id="summary">8. Summary</h2>

<ul>
  <li><strong>Description, not evaluation.</strong> xMark shows who was marking whom and when that changed, and puts numbers on something a broadcast clip shows only in part.</li>
  <li><strong>Breakdown by defender.</strong> Pitch control can tell you a space is open; marker contribution tells you which defender opened it.</li>
  <li><strong>Runs in behind.</strong> Runs where the defender is beaten but close are invisible to this family of models.</li>
</ul>

<p><strong>Limits.</strong> These are six selected scenes, not a measurement of how good anyone’s movement is. xMark has no body orientation. The pitch control model uses standard published parameters and was not tuned to this data.</p>

<h2 id="data">Data</h2>

<p>PFF FC open 2022 World Cup data (tracking for 49 matches). xMark as in <a href="/2026/09/getting-free-doesnt-get-you-the-ball/">the earlier post</a>, without the turn penalty. Pitch control: Spearman (2017), with the default parameters of Laurie Shaw’s implementation for the Friends of Tracking series.</p>

<ul>
  <li>Bekkers, J. (2025). Pressing Intensity: An Intuitive Measure for Pressing in Soccer. arXiv:2501.04712.</li>
  <li>Spearman, W. et al. (2017). Physics-Based Modeling of Pass Probabilities in Soccer. <em>MIT Sloan Sports Analytics Conference.</em></li>
  <li>Spearman, W. (2018). Beyond Expected Goals. <em>MIT Sloan Sports Analytics Conference.</em></li>
</ul>]]></content><author><name>napla-dev</name></author><summary type="html"><![CDATA[Using xMark, a tracking-data marking model, and pitch control to look at six off-ball runs from the 2022 World Cup: three that pull defenders away from a teammate, two that shake off a marker, and one the model can't see.]]></summary><media:thumbnail xmlns:media="http://search.yahoo.com/mrss/" url="https://napla-dev.github.io/assets/img/offball/card_fra-pol.png" /><media:content medium="image" url="https://napla-dev.github.io/assets/img/offball/card_fra-pol.png" xmlns:media="http://search.yahoo.com/mrss/" /></entry><entry><title type="html">Arriving Isn’t Keeping</title><link href="https://napla-dev.github.io/2026/10/arriving-isnt-keeping/" rel="alternate" type="text/html" title="Arriving Isn’t Keeping" /><published>2026-10-03T00:00:00+00:00</published><updated>2026-10-03T00:00:00+00:00</updated><id>https://napla-dev.github.io/2026/10/arriving-isnt-keeping</id><content type="html" xml:base="https://napla-dev.github.io/2026/10/arriving-isnt-keeping/"><![CDATA[<p><em>52,073 passes · 49 World Cup matches · PFF FC open tracking data</em></p>

<blockquote>
  <p><strong>TL;DR</strong>
- I model the two steps separately: the probability that a pass <strong>reaches</strong> its receiver, and the probability that the receiver then <strong>keeps</strong> it.
- Multiplying the two (I call it xSP, expected safe pass) splits each lost ball into “lost before reaching” and “lost after reaching”. For short and medium ground passes, roughly a third or more of expected losses come after the ball has arrived.
- As a pure predictor, the split doesn’t win: a model trained directly on “still in possession 3 seconds later” is more accurate. Its value is in showing <em>where</em> the ball is lost, not in predicting it better.
- Receptions that are already a duel when the ball arrives are lost a quarter of the time (half under a stricter definition), and my model can’t predict which ones.</p>
</blockquote>

<h2 id="the-question">1. The question</h2>

<p>Pass models usually measure success at one moment: did the ball reach a teammate (e.g. Spearman et al., 2017; Power et al., 2017)? But a “completed” pass can arrive with a defender on the receiver’s back, and the ball can be gone a second later.</p>

<p>I wanted to measure that second step. Given that a pass arrives, how likely is the receiver to keep the ball, and what does the situation at the moment of the pass tell us about it?</p>

<h2 id="setup">2. Setup</h2>

<p><strong>Data.</strong> PFF FC’s open 2022 World Cup data: tracking for 49 matches and the event data, which records each first touch and how each player’s spell on the ball ends. The tracking data has no body orientation, so for the receiver’s facing I use a proxy: the direction from the receiver to the passer relative to the attacking direction, grouped as facing goal (under 60°), side-on (60–120°) or back to goal (over 120°).</p>

<p><strong>What counts as keeping the ball.</strong> A reception counts as <em>kept</em> if the receiver’s spell ends with a deliberate pass, cross, shot or clearance (whatever happens to it), a foul won, or the team still in possession. It counts as <em>lost</em> if the receiver loses a duel, miscontrols the ball, or is dispossessed while carrying it. I also checked a stricter version that counts a pass or clearance given straight to the opponent within 3 seconds as a loss. That raises the failure rate across all receptions from 7% to 17%. The main conclusions hold under both definitions, with one exception noted in Section 5.</p>

<p><strong>One fix worth mentioning.</strong> My first features used velocities from a centred moving average, which quietly included about 0.13 s of the future. I rebuilt every feature from the last frame at least 0.15 s before the event. The results barely moved, but if you build features from smoothed tracking data, this is easy to miss.</p>

<h2 id="step-one-what-predicts-a-lost-first-touch">3. Step one: what predicts a lost first touch?</h2>

<p>For 32,298 ordinary receptions (the receiver controls the ball rather than playing it first time), 5.9% end in a lost ball. Adding tracking features to a baseline feature set improves prediction clearly (AUC 0.76 → 0.85 with gradient boosting, match-level bootstrap interval for the log-loss gain well away from zero), and the predicted probabilities are well calibrated.</p>

<p>The situations most associated with losing the ball are the expected ones:</p>

<table>
  <thead>
    <tr>
      <th>Situation at the moment of reception</th>
      <th>Loss rate</th>
    </tr>
  </thead>
  <tbody>
    <tr>
      <td>Nearest defender within 4.2 m</td>
      <td>16.8% (0.7% beyond 12 m)</td>
    </tr>
    <tr>
      <td>Receiver running faster than 2.9 m/s</td>
      <td>11.1% (3.0% when nearly stationary)</td>
    </tr>
    <tr>
      <td>Pass faster than 16 m/s</td>
      <td>9.0%</td>
    </tr>
  </tbody>
</table>

<p>These are associations, not causes, and the situations overlap with each other.</p>

<h2 id="step-two-splitting-a-pass-into-reaching-and-keeping">4. Step two: splitting a pass into reaching and keeping</h2>

<p>From the moment the pass is played, I estimate two probabilities, using only information available at that moment:</p>

\[\text{xSP} = \underbrace{P(\text{reaches the receiver})}_{\text{xPass}} \times \underbrace{P(\text{keeps it} \mid \text{reached})}_{\text{xControl}}\]

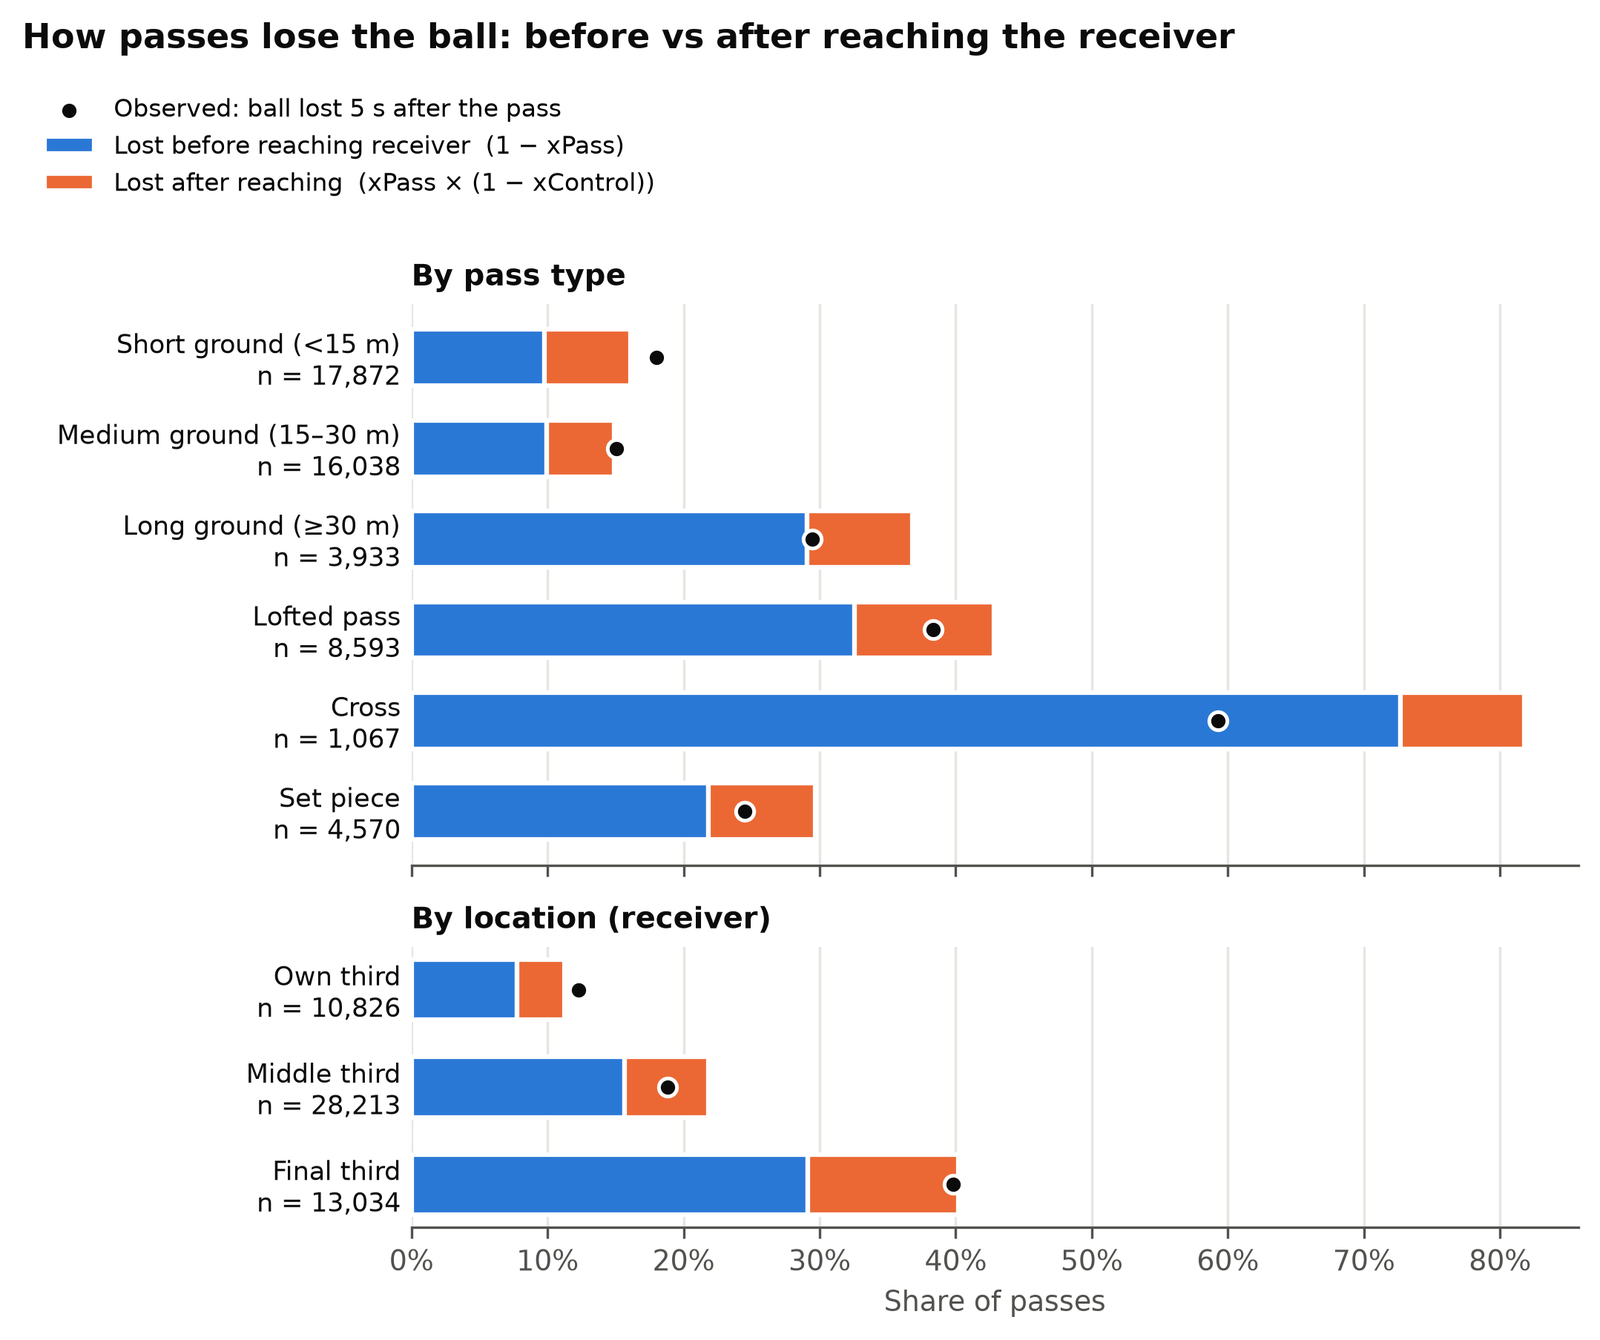
<p>The probability of losing the ball then splits into two parts:</p>

\[1 - \text{xSP} = \underbrace{(1 - \text{xPass})}_{\text{lost before reaching}} + \underbrace{\text{xPass}\,(1 - \text{xControl})}_{\text{lost after reaching}}\]
<figure>
  <img src="/assets/img/reception/fig_loss_decomposition.png" alt="Stacked bars of expected loss before and after reaching the receiver, by pass type and by location, with observed loss rates as dots" />
  <figcaption>Figure 1. Expected losses split into "before reaching" (blue) and "after reaching" (orange), with the observed rate of losing the ball within 5 seconds as dots. Crosses sit well above their dot because the model counts every cross that misses its target as a loss, while the 5-second outcome does not (a blocked cross that goes out for a corner keeps possession).</figcaption>
</figure>

<p><strong>For short and medium ground passes, roughly a third or more of expected losses come after the ball has arrived.</strong></p>

<p>Three things stand out:</p>

<ul>
  <li>Long, lofted passes and crosses are lost mostly before they arrive. The blue part dominates.</li>
  <li>Short and medium ground passes are different. They rarely fail to arrive, so a large share of their losses comes after the ball arrives.</li>
  <li>In the final third, losses after reaching grow too. The ball arrives in tighter spaces, and keeping it gets harder.</li>
</ul>

<p>For most groups, the model’s total sits close to the observed rate. Long passes, lofted passes and set pieces are overestimated by a few points, and crosses by much more, for the reason given in the caption.</p>

<h2 id="does-the-split-predict-better">5. Does the split predict better?</h2>

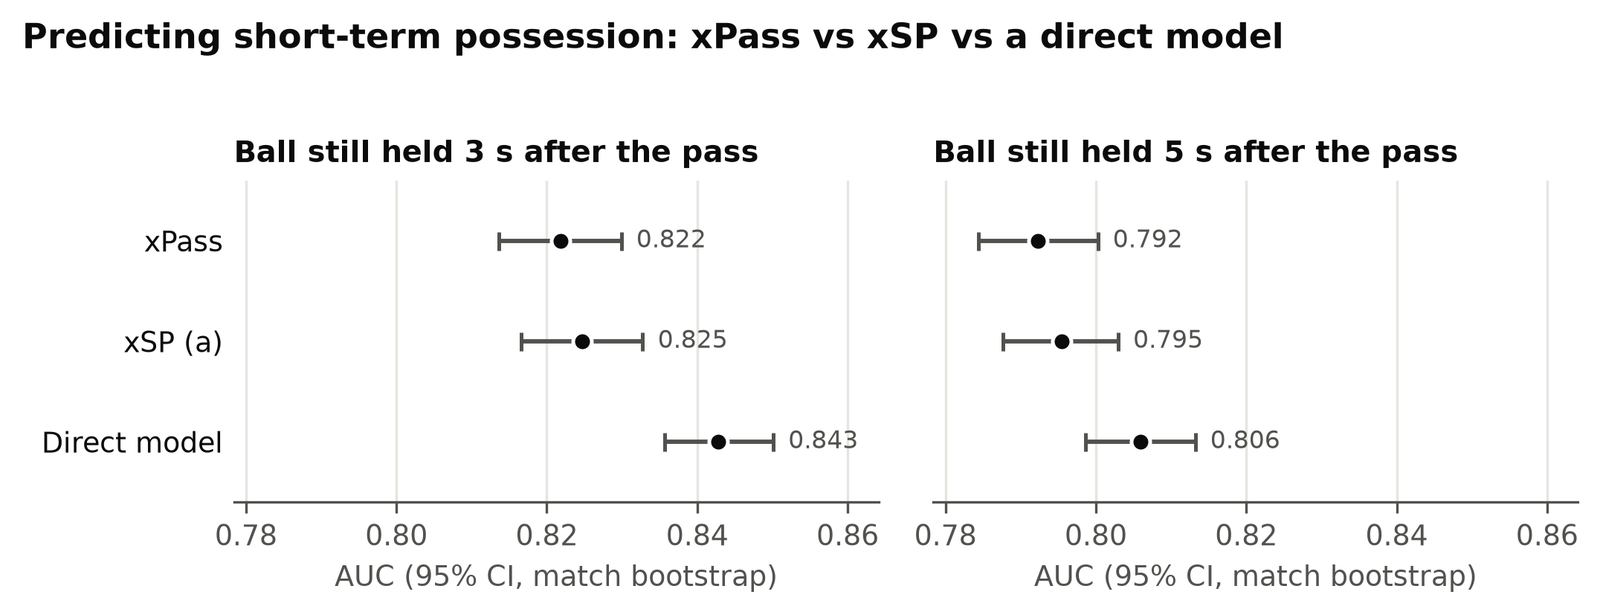
<p><strong>A model trained directly on the outcome predicts better than the split (+0.018 AUC over xSP at 3 seconds); the split’s value is in explaining where the ball is lost, not in predicting it.</strong> I compared three ways of predicting whether the team still has the ball 3 or 5 seconds after the pass: xPass alone, xSP, and a model trained directly on that outcome using the same features.</p>

<figure>
  <img src="/assets/img/reception/fig_auc_comparison.png" alt="AUC with confidence intervals for xPass, xSP and a direct model at 3 and 5 seconds; the direct model is highest" />
  <figcaption>Figure 2. AUC for predicting possession 3 and 5 seconds after the pass. The intervals for xPass and xSP overlap, but in a paired comparison on the same matches xSP is slightly better (+0.003). The direct model is better than both.</figcaption>
</figure>

<p>xSP improves on xPass, but only slightly (AUC +0.003). With the stricter definition of keeping the ball, it no longer beats xPass at 3 seconds.</p>

<p>What the split adds is an explanation: the direct model can say <em>how risky</em> a pass is, but not whether the risk lies in getting the ball there or in keeping it once it arrives. That distinction may be more useful to an analyst, and it is the reason to keep the two parts separate.</p>

<h2 id="what-the-model-cant-see">6. What the model can’t see</h2>

<p><strong>On receptions that are already a duel, the model’s AUC is 0.51, no better than chance, against 0.84 on ordinary receptions.</strong> (This is xControl, which sees only the moment the pass is played; the 0.85 in Section 3 is the first-touch model, which sees the moment of reception.) Some receptions are already a duel when the ball arrives: 1,655 in this data. A quarter of them end in a lost ball by the main definition, and half by the stricter one.</p>

<p>The model can’t tell which. These duels are also where you would expect keeping the ball to matter most, for long balls and crosses in particular. The likely reason is that the tracking data has positions and speeds but not body shape, arm contact or timing of the jump, which is what decides a contested ball.</p>

<h2 id="summary">7. Summary</h2>

<ul>
  <li><strong>The split.</strong> Even when it doesn’t improve prediction, the split changes the picture: for short passes, a sizeable share of the risk sits after the ball arrives.</li>
  <li><strong>Comparison with a direct model.</strong> A decomposed metric should be checked against the simplest model of the same outcome. Here it lost, and that limits what I can claim for it.</li>
  <li><strong>Contested receptions.</strong> They are frequent, costly, and invisible to position-and-speed features.</li>
</ul>

<p><strong>Limits.</strong> One tournament, 49 matches with tracking. The receiver’s body orientation is only approximated, and agrees moderately with PFF’s own labels (κ = 0.40). I don’t report player rankings.</p>

<h2 id="data">Data</h2>

<p>PFF FC open 2022 World Cup data (tracking for 49 matches, events for 64). Models: gradient-boosted trees (LightGBM) and logistic regression, with match-grouped cross-validation. All intervals are match-level bootstrap.</p>

<h2 id="references">References</h2>

<ul>
  <li>Spearman, W. et al. (2017). Physics-Based Modeling of Pass Probabilities in Soccer. <em>MIT Sloan Sports Analytics Conference.</em></li>
  <li>Power, P. et al. (2017). Not All Passes Are Created Equal: Objectively Measuring the Risk and Reward of Passes in Soccer from Tracking Data. <em>KDD.</em></li>
</ul>]]></content><author><name>napla-dev</name></author><summary type="html"><![CDATA[Pass completion models stop when the ball arrives. Using PFF FC's 2022 World Cup tracking data, I add a second step: can the receiver keep it? What the split shows, where it doesn't help, and what it can't see.]]></summary><media:thumbnail xmlns:media="http://search.yahoo.com/mrss/" url="https://napla-dev.github.io/assets/img/reception/fig_loss_decomposition.png" /><media:content medium="image" url="https://napla-dev.github.io/assets/img/reception/fig_loss_decomposition.png" xmlns:media="http://search.yahoo.com/mrss/" /></entry><entry><title type="html">xMark: Measuring Who Marks Whom</title><link href="https://napla-dev.github.io/2026/09/getting-free-doesnt-get-you-the-ball/" rel="alternate" type="text/html" title="xMark: Measuring Who Marks Whom" /><published>2026-09-23T00:00:00+00:00</published><updated>2026-09-23T00:00:00+00:00</updated><id>https://napla-dev.github.io/2026/09/getting-free-doesnt-get-you-the-ball</id><content type="html" xml:base="https://napla-dev.github.io/2026/09/getting-free-doesnt-get-you-the-ball/"><![CDATA[<p><em>49 World Cup matches · 1.02 million frames · updated 2 October 2026</em></p>

<blockquote>
  <p><strong>TL;DR</strong>
- I built a model of which attacker each defender is covering, which I call <strong>xMark</strong>, from PFF FC’s open 2022 World Cup tracking data.
- Checked against PFF’s human-coded pressure labels, the model agrees with the analysts, and it names the defender who actually pressed the receiver slightly better than a “nearest defender” rule does.
- But xMark turned out to be a poor input for predicting danger. And an attacker who escapes their marker is <strong>not detectably more likely to receive the ball</strong> than one who is still marked.</p>
</blockquote>

<h2 id="the-question">1. The question</h2>

<p>Football analytics can tell us who controls which part of the pitch (pitch control) and how valuable each attacker’s position is (OBSO). It is less developed on a question coaches often ask: <strong>who is marking whom, and what does it cost when nobody is?</strong> This post builds a model for that, checks whether it measures what it claims to, and then tries to use it.</p>

<h2 id="the-model">2. The model</h2>

<p>The model has three steps: how long each defender needs to reach an attacker, how likely that makes each defender to cover him, and how well the team covers him overall.</p>

<p><strong>Step 1: time to arrive.</strong> For every attacker \(j\) in every frame, I estimate how long each defender \(i\) would need to reach the spot where the attacker is heading:</p>

\[T_{ij} = \tau_r + \frac{\lVert (\mathbf r_j + \mathbf v_j \Delta) - (\mathbf r_i + \mathbf v_i \tau_r) \rVert}{v_{\max}}\]

<ul>
  <li>\(\mathbf r_i, \mathbf v_i\) and \(\mathbf r_j, \mathbf v_j\): the current positions and velocities of defender \(i\) and attacker \(j\), from the tracking data.</li>
  <li>\(\mathbf r_j + \mathbf v_j \Delta\): where the attacker will be in \(\Delta = 1\) s if he keeps moving the same way.</li>
  <li>\(\tau_r = 0.7\) s: the defender’s reaction time. During it he keeps drifting in his current direction, so his starting point is \(\mathbf r_i + \mathbf v_i \tau_r\).</li>
  <li>\(\lVert \cdot \rVert\): the straight-line distance between those two points, and \(v_{\max} = 5\) m/s: the defender’s top running speed.</li>
</ul>

<p>So \(T_{ij}\) is “reaction time plus the time to run the remaining distance at full speed”.</p>

<p><strong>Step 2: one defender’s coverage.</strong> A defender who can arrive well within \(T = 1.5\) s covers the attacker; one who can’t, doesn’t. A logistic curve turns the gap between the two into a probability:</p>

\[p_{ij} = \frac{1}{1 + \exp\!\left( -\dfrac{\pi}{\sqrt{3}\,\sigma}\,(T - T_{ij}) \right)}\]

<ul>
  <li>\(p_{ij}\): the probability that defender \(i\) alone covers attacker \(j\).</li>
  <li>\(T - T_{ij}\): how much time the defender has to spare. Positive means he gets there in time; negative means he doesn’t.</li>
  <li>\(\sigma = 0.45\) s: how gradual the curve is. With exactly no time to spare, \(p_{ij} = 0.5\); a few tenths of a second either way moves it towards 0 or 1.</li>
</ul>

<p><strong>Step 3: the team’s coverage, xMark.</strong> The attacker is covered if <em>at least one</em> defender covers him, which is one minus the probability that every defender fails:</p>

\[P_j = 1 - \prod_{i} (1 - p_{ij})\]

<ul>
  <li>\(P_j\): <strong>xMark</strong>, the team’s coverage of attacker \(j\), between 0 and 1. Despite the name, it measures whether a defender <em>can reach</em> the attacker in time, not whether he is actually marking him.</li>
  <li>\(\prod_i (1 - p_{ij})\): the probability that every defender fails, assuming they fail independently. Outfield players only; goalkeepers are excluded.</li>
</ul>

<p>Steps 1 to 3 are not new. They follow Joris Bekkers’ Pressing Intensity (2025), which applies Spearman’s pitch-control physics to pressure, and the parameters \(T\) and \(\sigma\) are his. The name xMark refers to how I use it: as a measure of marking, broken down by defender (below) and checked against human labels (Section 3).</p>

<p><strong>Who is marking whom.</strong> One more quantity matters later. A defender’s <strong>marker contribution</strong> is how much xMark falls if you remove him:</p>

\[m_{ij} = P_j - P_j^{(-i)}\]

<ul>
  <li>\(P_j^{(-i)}\): xMark of attacker \(j\) recalculated without defender \(i\).</li>
</ul>

<p>The defender with the largest \(m_{ij}\) is the model’s answer to “who is marking this attacker?”. It is usually, but not always, the nearest defender.</p>

<h2 id="does-it-measure-what-it-claims">3. Does it measure what it claims?</h2>

<p>Before using the model, I checked it against an independent source (as Davis et al., 2024 recommend for sports metrics). PFF’s analysts record, for every first touch, whether the receiver was under pressure and which defender applied it. I compared the model’s view 0.4 seconds before the ball arrived with the analysts’ label.</p>

<p>xMark agrees with the analysts. Across 40,388 receptions, \(P_j\) predicts whether the receiver was pressured with an AUC of 0.83. A plain “distance to the nearest defender” does about as well (0.83), so for this simple yes-or-no question the physics adds little.</p>

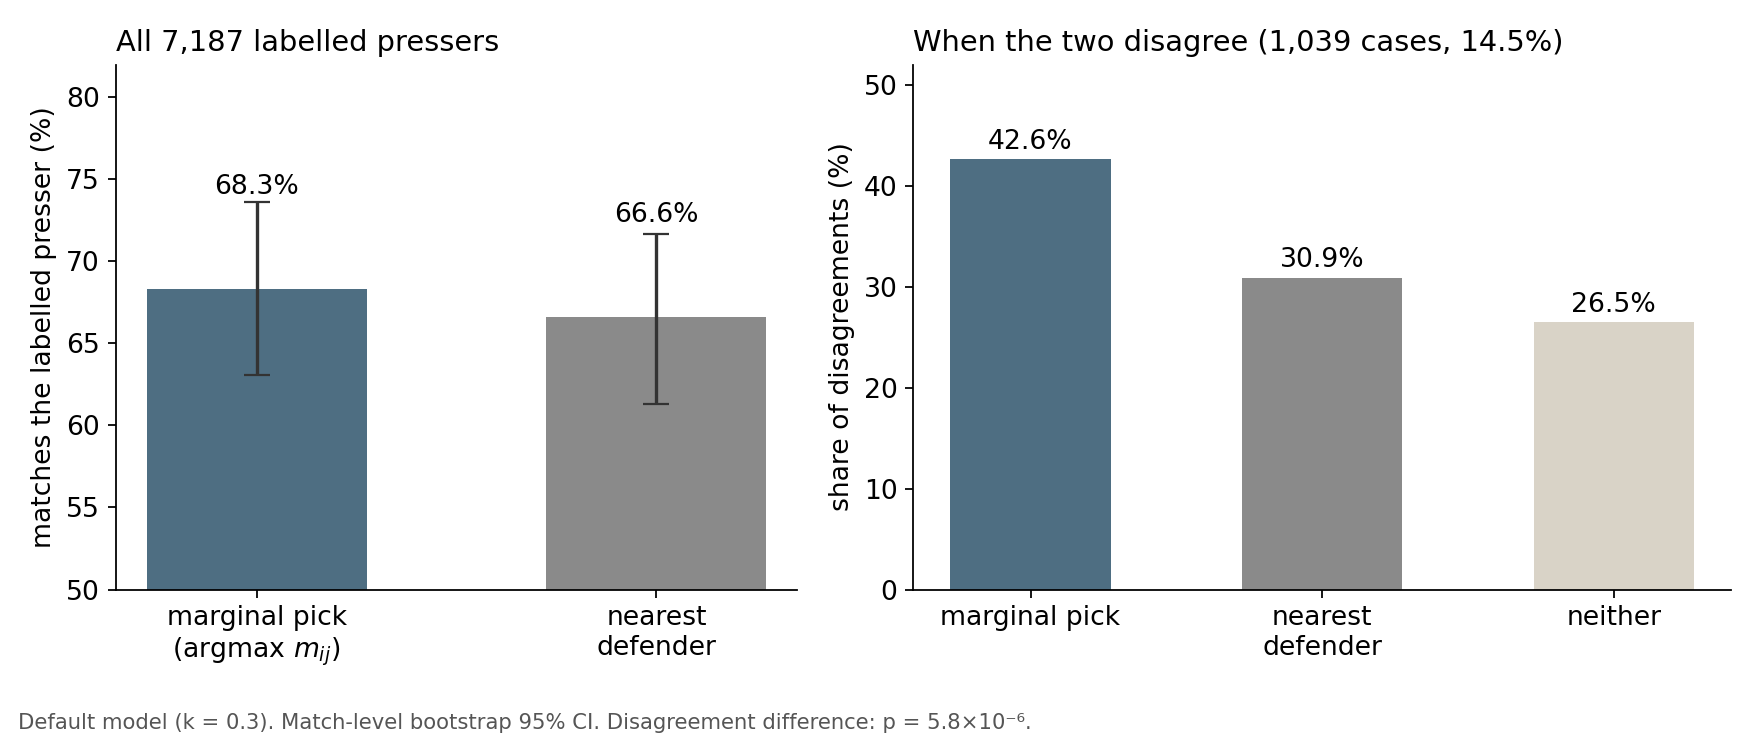
<p>The model is better at saying <em>who</em>. For the 7,187 receptions where the analysts named the defender who applied pressure, the model picks the same defender 68.8% of the time, against 66.6% for the nearest defender (Figure 1).</p>

<figure>
  <img src="/assets/img/coverage/fig_attribution.png" alt="Left: the marker-contribution pick matches the labelled presser 68.3% of the time against 66.6% for the nearest defender. Right: when the two disagree, the label sides with the marker-contribution pick 42.6% of the time, the nearest defender 30.9%, neither 26.5%" />
  <figcaption>Figure 1. How often each rule names the same defender as PFF's analysts. Right: the 14.5% of cases where the model and the nearest-defender rule disagree. Match-level bootstrap 95% CIs. Shown for the original model with the turn penalty (68.3%; in disagreements 42.6% against 30.9%). The text quotes the final model without it (Section 3): 68.8%, and 46.3% against 30.1% in the 13.4% of cases where the two rules disagree.</figcaption>
</figure>

<p><strong>When the model and the nearest-defender rule disagree, the analysts side with the model 46% of the time and with the nearest defender 30% (p &lt; 0.0001).</strong> This suggests the model picks up which of two nearby defenders is moving to engage, not just which one is closer.</p>

<p>This check also removed a component. My first version, following Bekkers, added a penalty for defenders running the wrong way. Against the human labels it made both xMark and attribution slightly <em>worse</em>, so I dropped it. I re-checked the results below without it on five matches, and none of the conclusions change.</p>

<h2 id="use-one-is-uncovered-threat-more-dangerous">4. Use one: is uncovered threat more dangerous?</h2>

<p>The obvious application: give every attacker a threat value \(V_j\) (how likely a pass reaches them, times the xG of their position), discount it by how well they are covered, and add it up:</p>

\[U(t) = \sum_j V_j \,(1 - P_j)\]

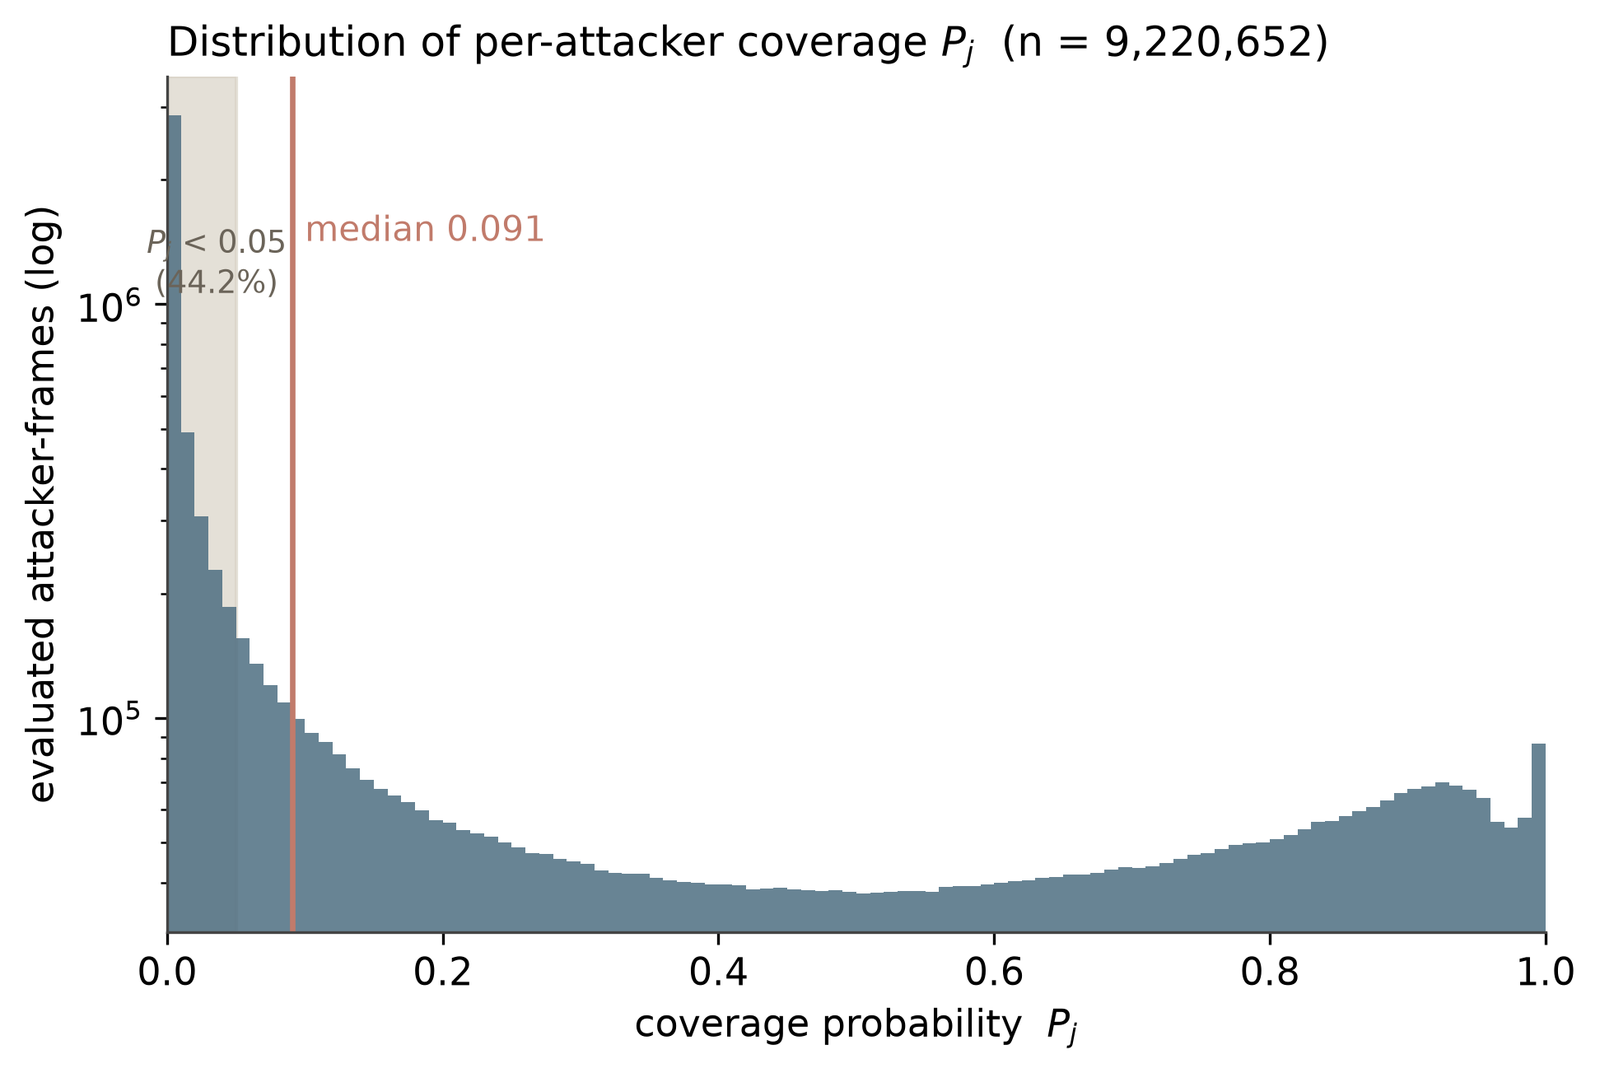
<p><strong>Discounting threat by xMark did not improve prediction: raw threat did slightly better at every horizon I tested (rank correlation with xG in the next 3 seconds: 0.174 against 0.163).</strong> The test was whether \(U\), if xMark carries information, predicts the next few seconds’ shots better than raw threat \(\sum_j V_j\). Changing how \(U\) is aggregated doesn’t help either.</p>

<figure>
  <img src="/assets/img/marking/fig_pj_distribution.png" alt="Histogram of xMark on a log scale, with most mass near zero and a second hump near one" />
  <figcaption>Figure 2. xMark across 9.2 million attacker-frames (log scale). Nearly half sit below 0.05.</figcaption>
</figure>

<p>There are two reasons.</p>

<ul>
  <li>Most attackers are uncovered most of the time. The median xMark is 0.09, so the discount \((1 - P_j)\) is close to 1 almost everywhere, and \(U\) is nearly raw threat.</li>
  <li>xMark follows danger. Defenders converge where danger already is, so heavily covered threat goes with <em>more</em> xG conceded, not less. This looks like the familiar difficulty of measuring defence from observational data (see Bischofberger et al., 2026), and I don’t expect a better threat model alone to remove it.</li>
</ul>

<h2 id="use-two-does-escaping-your-marker-bring-the-ball">5. Use two: does escaping your marker bring the ball?</h2>

<p>If xMark can’t predict danger, maybe a <em>change</em> in xMark can. I detected moments when a covered attacker suddenly became free: xMark above 0.6 for half a second, collapsing below 0.2 within 0.7 s, and staying there. That gave 559 escapes I could line up with event data.</p>

<p>I compared them with moments where the same player, in the same match, was covered just as tightly but did <em>not</em> escape. Did the ball come?</p>

<table>
  <thead>
    <tr>
      <th> </th>
      <th>Escaped</th>
      <th>Still marked</th>
    </tr>
  </thead>
  <tbody>
    <tr>
      <td>Received a pass within 5 s</td>
      <td>8.6%</td>
      <td>8.2% (p = 0.83)</td>
    </tr>
  </tbody>
</table>

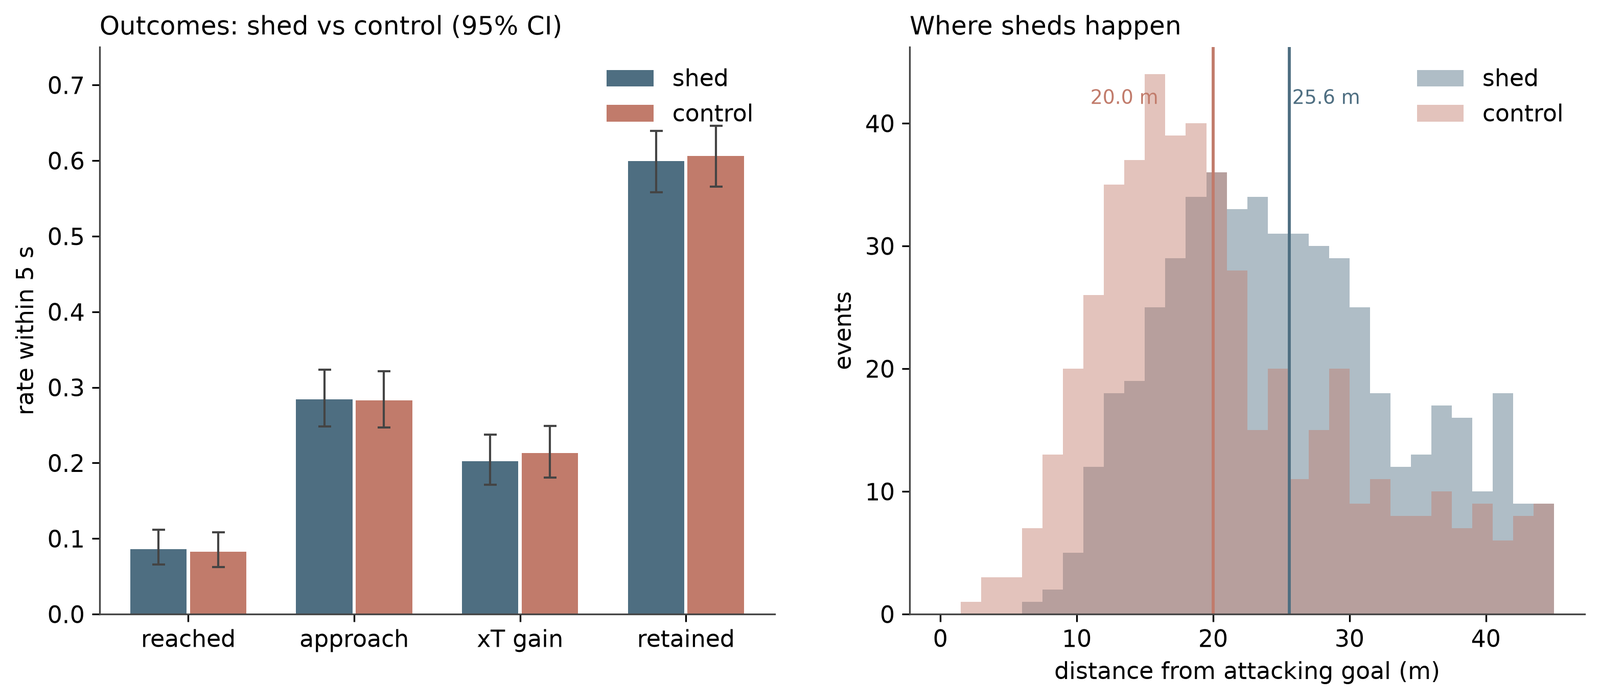
<p><strong>An attacker who had just escaped their marker received the ball about as often as one who was still marked (8.6% against 8.2%, p = 0.83).</strong> Controlling for location doesn’t change this: comparing within the same distance band (Mantel–Haenszel odds ratio 0.90, 95% CI 0.58–1.38), or against 406 controls matched to 406 escapes on lane, box and distance to goal, escaped and still-marked attackers receive the ball at the same rate (8.9% each); the interval is wide, so this rules out a large effect rather than any effect. The result held up under the checks I ran: the separation is real movement rather than a model artefact, passes aren’t missing from the data, the ball isn’t simply moving away, and wider outcomes (receiving after several passes, the ball getting closer, possession surviving) are equally flat.</p>

<figure>
  <img src="/assets/img/marking/fig_null_result_contrast.png" alt="Left: four outcome rates with overlapping confidence intervals for escapes and controls. Right: distance-to-goal distributions, with escapes further from goal" />
  <figcaption>Figure 3. Left: what happens next is indistinguishable between escapes and controls. Right: where it happens is not.</figcaption>
</figure>

<p>The one difference is <em>where</em> it happens. Escapes occur a median 25.6 m from goal against 20.0 m for controls, and only 11% happen inside the penalty area against 29% for controls. But location does not explain the null result: with location held equal, the two groups still receive the ball at the same rate.</p>

<h2 id="summary">6. Summary</h2>

<ul>
  <li><strong>Validation.</strong> Checking the model against human labels told me which parts worked (attribution), which part to remove (the turn penalty), and that the negative results in Sections 4 and 5 are unlikely to be caused by a broken model.</li>
  <li><strong>Getting free.</strong> It is tempting to treat an unmarked attacker as a dangerous one. In this tournament, getting free on its own was not followed by more involvement.</li>
  <li><strong>Baselines.</strong> Distance alone matches the model on “is he pressured?”. Where the model adds something is the harder question of <em>who</em> is doing the pressing.</li>
</ul>

<p><strong>Limits.</strong> This is one tournament: 49 matches, three to seven matches per player, so I don’t publish player rankings. The tracking data has no body orientation, and PFF’s pressure label is a human judgement that may itself lean on distance.</p>

<p><strong>Follow-up.</strong> xMark turned out to be a poor predictor, but it is good at something else: showing <em>who</em> is marking <em>whom</em>. In <a href="/2026/10/six-runs-and-a-blind-spot/">Six Runs and a Blind Spot</a> I use the same model to describe off-ball runs: which defender moved, and who that freed.</p>

<h2 id="data-and-references">Data and references</h2>

<p>Tracking and events: PFF FC open 2022 World Cup data. xG: logistic regression on StatsBomb open data. All confidence intervals are match-level bootstrap.</p>

<ul>
  <li>Spearman, W. (2018). Beyond Expected Goals. <em>MIT Sloan Sports Analytics Conference.</em></li>
  <li>Bekkers, J. (2025). Pressing Intensity: An Intuitive Measure for Pressing in Soccer. arXiv:2501.04712.</li>
  <li>Bischofberger, J. et al. (2026). Blame is easier than praise: Measuring off-ball defensive performance in football. arXiv:2606.19931.</li>
  <li>Davis, J. et al. (2024). Methodology and evaluation in sports analytics: challenges, approaches, and lessons learned. <em>Machine Learning.</em></li>
</ul>]]></content><author><name>napla-dev</name></author><summary type="html"><![CDATA[xMark, a marking model built on PFF FC's 2022 World Cup tracking data, validated against human-coded pressure labels, then put to two uses, both of which produced negative results.]]></summary><media:thumbnail xmlns:media="http://search.yahoo.com/mrss/" url="https://napla-dev.github.io/assets/img/marking/fig_null_result_contrast.png" /><media:content medium="image" url="https://napla-dev.github.io/assets/img/marking/fig_null_result_contrast.png" xmlns:media="http://search.yahoo.com/mrss/" /></entry></feed>