xMark: Measuring Who Marks Whom
Building a marking model from tracking data, checking it against human analysts, and testing whether getting free brings the ball
49 World Cup matches · 1.02 million frames · updated 2 October 2026
TL;DR - I built a model of which attacker each defender is covering, which I call xMark, from PFF FC’s open 2022 World Cup tracking data. - Checked against PFF’s human-coded pressure labels, the model agrees with the analysts, and it names the defender who actually pressed the receiver slightly better than a “nearest defender” rule does. - But xMark turned out to be a poor input for predicting danger. And an attacker who escapes their marker is not detectably more likely to receive the ball than one who is still marked.
1. The question
Football analytics can tell us who controls which part of the pitch (pitch control) and how valuable each attacker’s position is (OBSO). It is less developed on a question coaches often ask: who is marking whom, and what does it cost when nobody is? This post builds a model for that, checks whether it measures what it claims to, and then tries to use it.
2. The model
The model has three steps: how long each defender needs to reach an attacker, how likely that makes each defender to cover him, and how well the team covers him overall.
Step 1: time to arrive. For every attacker \(j\) in every frame, I estimate how long each defender \(i\) would need to reach the spot where the attacker is heading:
\[T_{ij} = \tau_r + \frac{\lVert (\mathbf r_j + \mathbf v_j \Delta) - (\mathbf r_i + \mathbf v_i \tau_r) \rVert}{v_{\max}}\]- \(\mathbf r_i, \mathbf v_i\) and \(\mathbf r_j, \mathbf v_j\): the current positions and velocities of defender \(i\) and attacker \(j\), from the tracking data.
- \(\mathbf r_j + \mathbf v_j \Delta\): where the attacker will be in \(\Delta = 1\) s if he keeps moving the same way.
- \(\tau_r = 0.7\) s: the defender’s reaction time. During it he keeps drifting in his current direction, so his starting point is \(\mathbf r_i + \mathbf v_i \tau_r\).
- \(\lVert \cdot \rVert\): the straight-line distance between those two points, and \(v_{\max} = 5\) m/s: the defender’s top running speed.
So \(T_{ij}\) is “reaction time plus the time to run the remaining distance at full speed”.
Step 2: one defender’s coverage. A defender who can arrive well within \(T = 1.5\) s covers the attacker; one who can’t, doesn’t. A logistic curve turns the gap between the two into a probability:
\[p_{ij} = \frac{1}{1 + \exp\!\left( -\dfrac{\pi}{\sqrt{3}\,\sigma}\,(T - T_{ij}) \right)}\]- \(p_{ij}\): the probability that defender \(i\) alone covers attacker \(j\).
- \(T - T_{ij}\): how much time the defender has to spare. Positive means he gets there in time; negative means he doesn’t.
- \(\sigma = 0.45\) s: how gradual the curve is. With exactly no time to spare, \(p_{ij} = 0.5\); a few tenths of a second either way moves it towards 0 or 1.
Step 3: the team’s coverage, xMark. The attacker is covered if at least one defender covers him, which is one minus the probability that every defender fails:
\[P_j = 1 - \prod_{i} (1 - p_{ij})\]- \(P_j\): xMark, the team’s coverage of attacker \(j\), between 0 and 1. Despite the name, it measures whether a defender can reach the attacker in time, not whether he is actually marking him.
- \(\prod_i (1 - p_{ij})\): the probability that every defender fails, assuming they fail independently. Outfield players only; goalkeepers are excluded.
Steps 1 to 3 are not new. They follow Joris Bekkers’ Pressing Intensity (2025), which applies Spearman’s pitch-control physics to pressure, and the parameters \(T\) and \(\sigma\) are his. The name xMark refers to how I use it: as a measure of marking, broken down by defender (below) and checked against human labels (Section 3).
Who is marking whom. One more quantity matters later. A defender’s marker contribution is how much xMark falls if you remove him:
\[m_{ij} = P_j - P_j^{(-i)}\]- \(P_j^{(-i)}\): xMark of attacker \(j\) recalculated without defender \(i\).
The defender with the largest \(m_{ij}\) is the model’s answer to “who is marking this attacker?”. It is usually, but not always, the nearest defender.
3. Does it measure what it claims?
Before using the model, I checked it against an independent source (as Davis et al., 2024 recommend for sports metrics). PFF’s analysts record, for every first touch, whether the receiver was under pressure and which defender applied it. I compared the model’s view 0.4 seconds before the ball arrived with the analysts’ label.
xMark agrees with the analysts. Across 40,388 receptions, \(P_j\) predicts whether the receiver was pressured with an AUC of 0.83. A plain “distance to the nearest defender” does about as well (0.83), so for this simple yes-or-no question the physics adds little.
The model is better at saying who. For the 7,187 receptions where the analysts named the defender who applied pressure, the model picks the same defender 68.8% of the time, against 66.6% for the nearest defender (Figure 1).
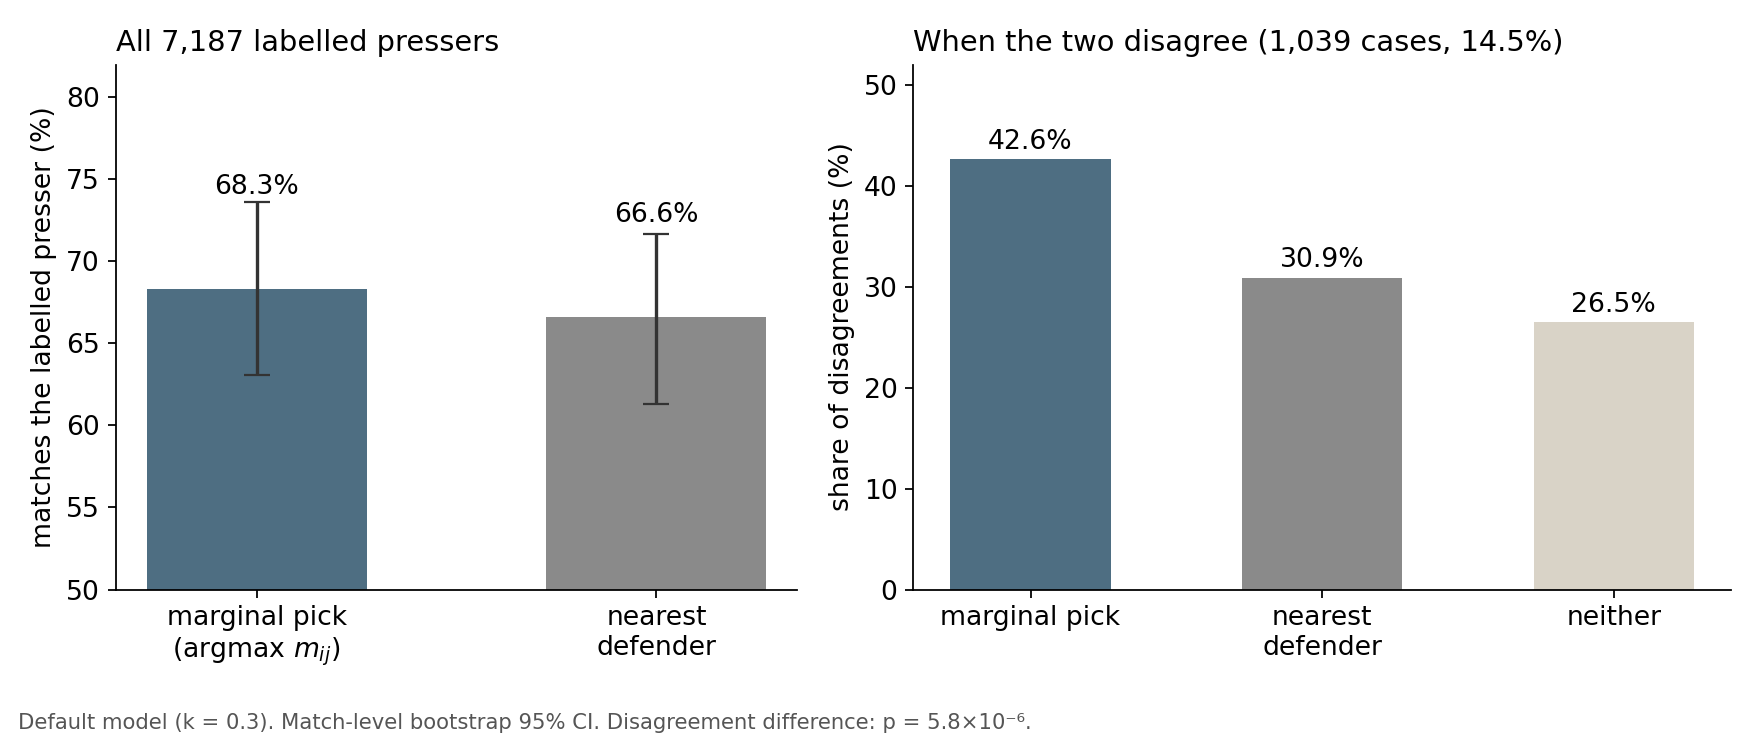
When the model and the nearest-defender rule disagree, the analysts side with the model 46% of the time and with the nearest defender 30% (p < 0.0001). This suggests the model picks up which of two nearby defenders is moving to engage, not just which one is closer.
This check also removed a component. My first version, following Bekkers, added a penalty for defenders running the wrong way. Against the human labels it made both xMark and attribution slightly worse, so I dropped it. I re-checked the results below without it on five matches, and none of the conclusions change.
4. Use one: is uncovered threat more dangerous?
The obvious application: give every attacker a threat value \(V_j\) (how likely a pass reaches them, times the xG of their position), discount it by how well they are covered, and add it up:
\[U(t) = \sum_j V_j \,(1 - P_j)\]Discounting threat by xMark did not improve prediction: raw threat did slightly better at every horizon I tested (rank correlation with xG in the next 3 seconds: 0.174 against 0.163). The test was whether \(U\), if xMark carries information, predicts the next few seconds’ shots better than raw threat \(\sum_j V_j\). Changing how \(U\) is aggregated doesn’t help either.
There are two reasons.
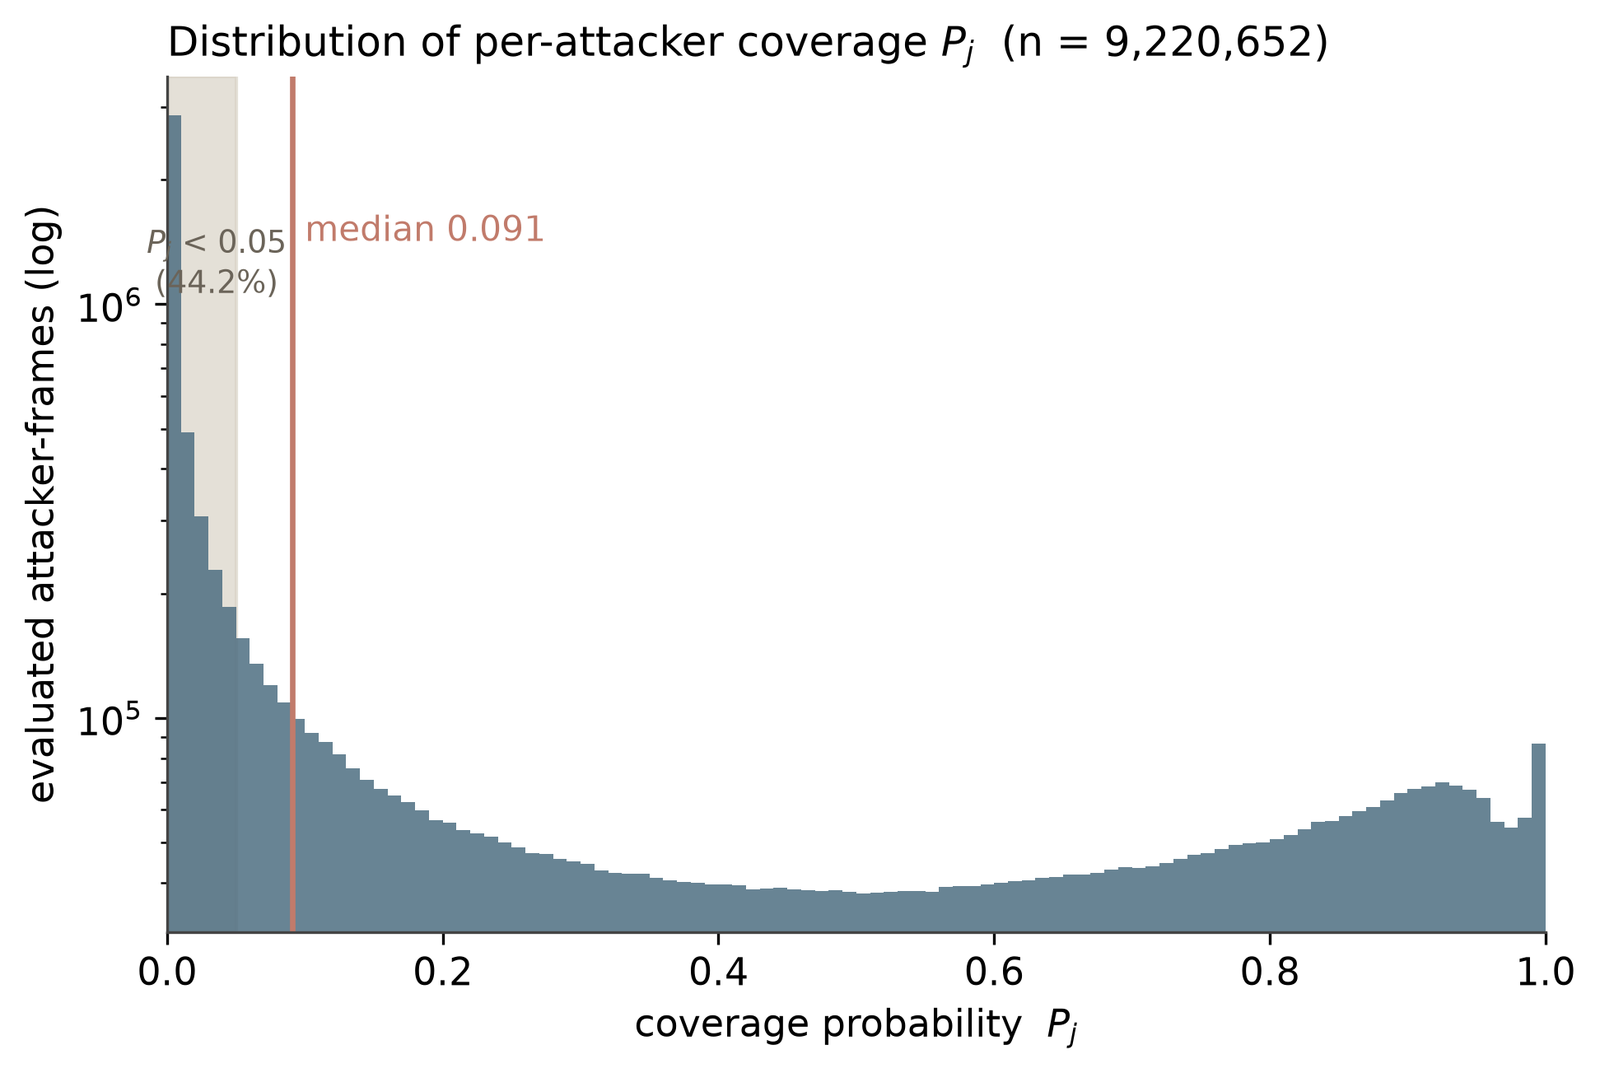
- Most attackers are uncovered most of the time. The median xMark is 0.09, so the discount \((1 - P_j)\) is close to 1 almost everywhere, and \(U\) is nearly raw threat.
- xMark follows danger. Defenders converge where danger already is, so heavily covered threat goes with more xG conceded, not less. This looks like the familiar difficulty of measuring defence from observational data (see Bischofberger et al., 2026), and I don’t expect a better threat model alone to remove it.
5. Use two: does escaping your marker bring the ball?
If xMark can’t predict danger, maybe a change in xMark can. I detected moments when a covered attacker suddenly became free: xMark above 0.6 for half a second, collapsing below 0.2 within 0.7 s, and staying there. That gave 559 escapes I could line up with event data.
I compared them with moments where the same player, in the same match, was covered just as tightly but did not escape. Did the ball come?
| Escaped | Still marked | |
|---|---|---|
| Received a pass within 5 s | 8.6% | 8.2% (p = 0.83) |
An attacker who had just escaped their marker received the ball about as often as one who was still marked (8.6% against 8.2%, p = 0.83). Controlling for location doesn’t change this: comparing within the same distance band (Mantel–Haenszel odds ratio 0.90, 95% CI 0.58–1.38), or against 406 controls matched to 406 escapes on lane, box and distance to goal, escaped and still-marked attackers receive the ball at the same rate (8.9% each); the interval is wide, so this rules out a large effect rather than any effect. The result held up under the checks I ran: the separation is real movement rather than a model artefact, passes aren’t missing from the data, the ball isn’t simply moving away, and wider outcomes (receiving after several passes, the ball getting closer, possession surviving) are equally flat.
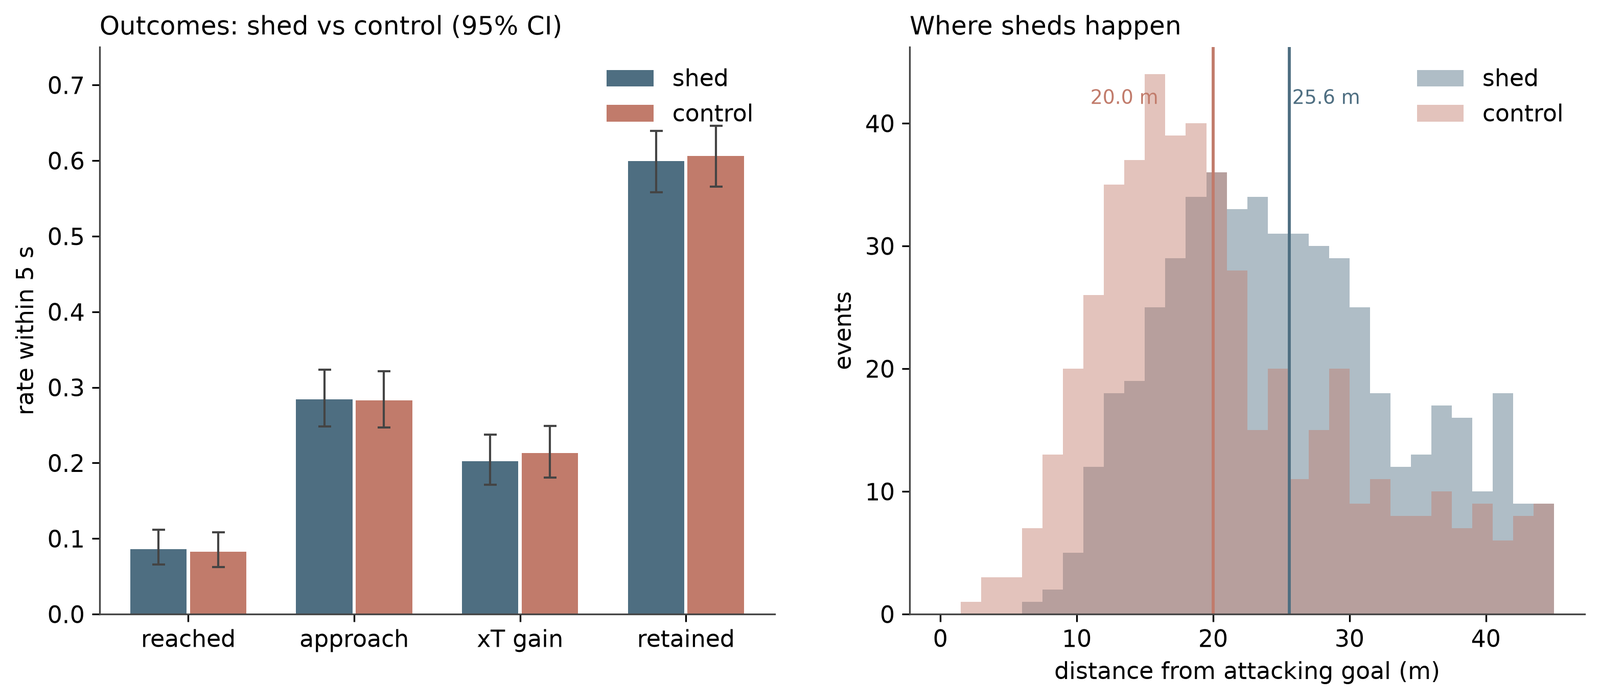
The one difference is where it happens. Escapes occur a median 25.6 m from goal against 20.0 m for controls, and only 11% happen inside the penalty area against 29% for controls. But location does not explain the null result: with location held equal, the two groups still receive the ball at the same rate.
6. Summary
- Validation. Checking the model against human labels told me which parts worked (attribution), which part to remove (the turn penalty), and that the negative results in Sections 4 and 5 are unlikely to be caused by a broken model.
- Getting free. It is tempting to treat an unmarked attacker as a dangerous one. In this tournament, getting free on its own was not followed by more involvement.
- Baselines. Distance alone matches the model on “is he pressured?”. Where the model adds something is the harder question of who is doing the pressing.
Limits. This is one tournament: 49 matches, three to seven matches per player, so I don’t publish player rankings. The tracking data has no body orientation, and PFF’s pressure label is a human judgement that may itself lean on distance.
Follow-up. xMark turned out to be a poor predictor, but it is good at something else: showing who is marking whom. In Six Runs and a Blind Spot I use the same model to describe off-ball runs: which defender moved, and who that freed.
Data and references
Tracking and events: PFF FC open 2022 World Cup data. xG: logistic regression on StatsBomb open data. All confidence intervals are match-level bootstrap.
- Spearman, W. (2018). Beyond Expected Goals. MIT Sloan Sports Analytics Conference.
- Bekkers, J. (2025). Pressing Intensity: An Intuitive Measure for Pressing in Soccer. arXiv:2501.04712.
- Bischofberger, J. et al. (2026). Blame is easier than praise: Measuring off-ball defensive performance in football. arXiv:2606.19931.
- Davis, J. et al. (2024). Methodology and evaluation in sports analytics: challenges, approaches, and lessons learned. Machine Learning.