Arriving Isn't Keeping
Splitting pass success into reaching the receiver and keeping the ball
52,073 passes · 49 World Cup matches · PFF FC open tracking data
TL;DR - I model the two steps separately: the probability that a pass reaches its receiver, and the probability that the receiver then keeps it. - Multiplying the two (I call it xSP, expected safe pass) splits each lost ball into “lost before reaching” and “lost after reaching”. For short and medium ground passes, roughly a third or more of expected losses come after the ball has arrived. - As a pure predictor, the split doesn’t win: a model trained directly on “still in possession 3 seconds later” is more accurate. Its value is in showing where the ball is lost, not in predicting it better. - Receptions that are already a duel when the ball arrives are lost a quarter of the time (half under a stricter definition), and my model can’t predict which ones.
1. The question
Pass models usually measure success at one moment: did the ball reach a teammate (e.g. Spearman et al., 2017; Power et al., 2017)? But a “completed” pass can arrive with a defender on the receiver’s back, and the ball can be gone a second later.
I wanted to measure that second step. Given that a pass arrives, how likely is the receiver to keep the ball, and what does the situation at the moment of the pass tell us about it?
2. Setup
Data. PFF FC’s open 2022 World Cup data: tracking for 49 matches and the event data, which records each first touch and how each player’s spell on the ball ends. The tracking data has no body orientation, so for the receiver’s facing I use a proxy: the direction from the receiver to the passer relative to the attacking direction, grouped as facing goal (under 60°), side-on (60–120°) or back to goal (over 120°).
What counts as keeping the ball. A reception counts as kept if the receiver’s spell ends with a deliberate pass, cross, shot or clearance (whatever happens to it), a foul won, or the team still in possession. It counts as lost if the receiver loses a duel, miscontrols the ball, or is dispossessed while carrying it. I also checked a stricter version that counts a pass or clearance given straight to the opponent within 3 seconds as a loss. That raises the failure rate across all receptions from 7% to 17%. The main conclusions hold under both definitions, with one exception noted in Section 5.
One fix worth mentioning. My first features used velocities from a centred moving average, which quietly included about 0.13 s of the future. I rebuilt every feature from the last frame at least 0.15 s before the event. The results barely moved, but if you build features from smoothed tracking data, this is easy to miss.
3. Step one: what predicts a lost first touch?
For 32,298 ordinary receptions (the receiver controls the ball rather than playing it first time), 5.9% end in a lost ball. Adding tracking features to a baseline feature set improves prediction clearly (AUC 0.76 → 0.85 with gradient boosting, match-level bootstrap interval for the log-loss gain well away from zero), and the predicted probabilities are well calibrated.
The situations most associated with losing the ball are the expected ones:
| Situation at the moment of reception | Loss rate |
|---|---|
| Nearest defender within 4.2 m | 16.8% (0.7% beyond 12 m) |
| Receiver running faster than 2.9 m/s | 11.1% (3.0% when nearly stationary) |
| Pass faster than 16 m/s | 9.0% |
These are associations, not causes, and the situations overlap with each other.
4. Step two: splitting a pass into reaching and keeping
From the moment the pass is played, I estimate two probabilities, using only information available at that moment:
\[\text{xSP} = \underbrace{P(\text{reaches the receiver})}_{\text{xPass}} \times \underbrace{P(\text{keeps it} \mid \text{reached})}_{\text{xControl}}\]The probability of losing the ball then splits into two parts:
\[1 - \text{xSP} = \underbrace{(1 - \text{xPass})}_{\text{lost before reaching}} + \underbrace{\text{xPass}\,(1 - \text{xControl})}_{\text{lost after reaching}}\]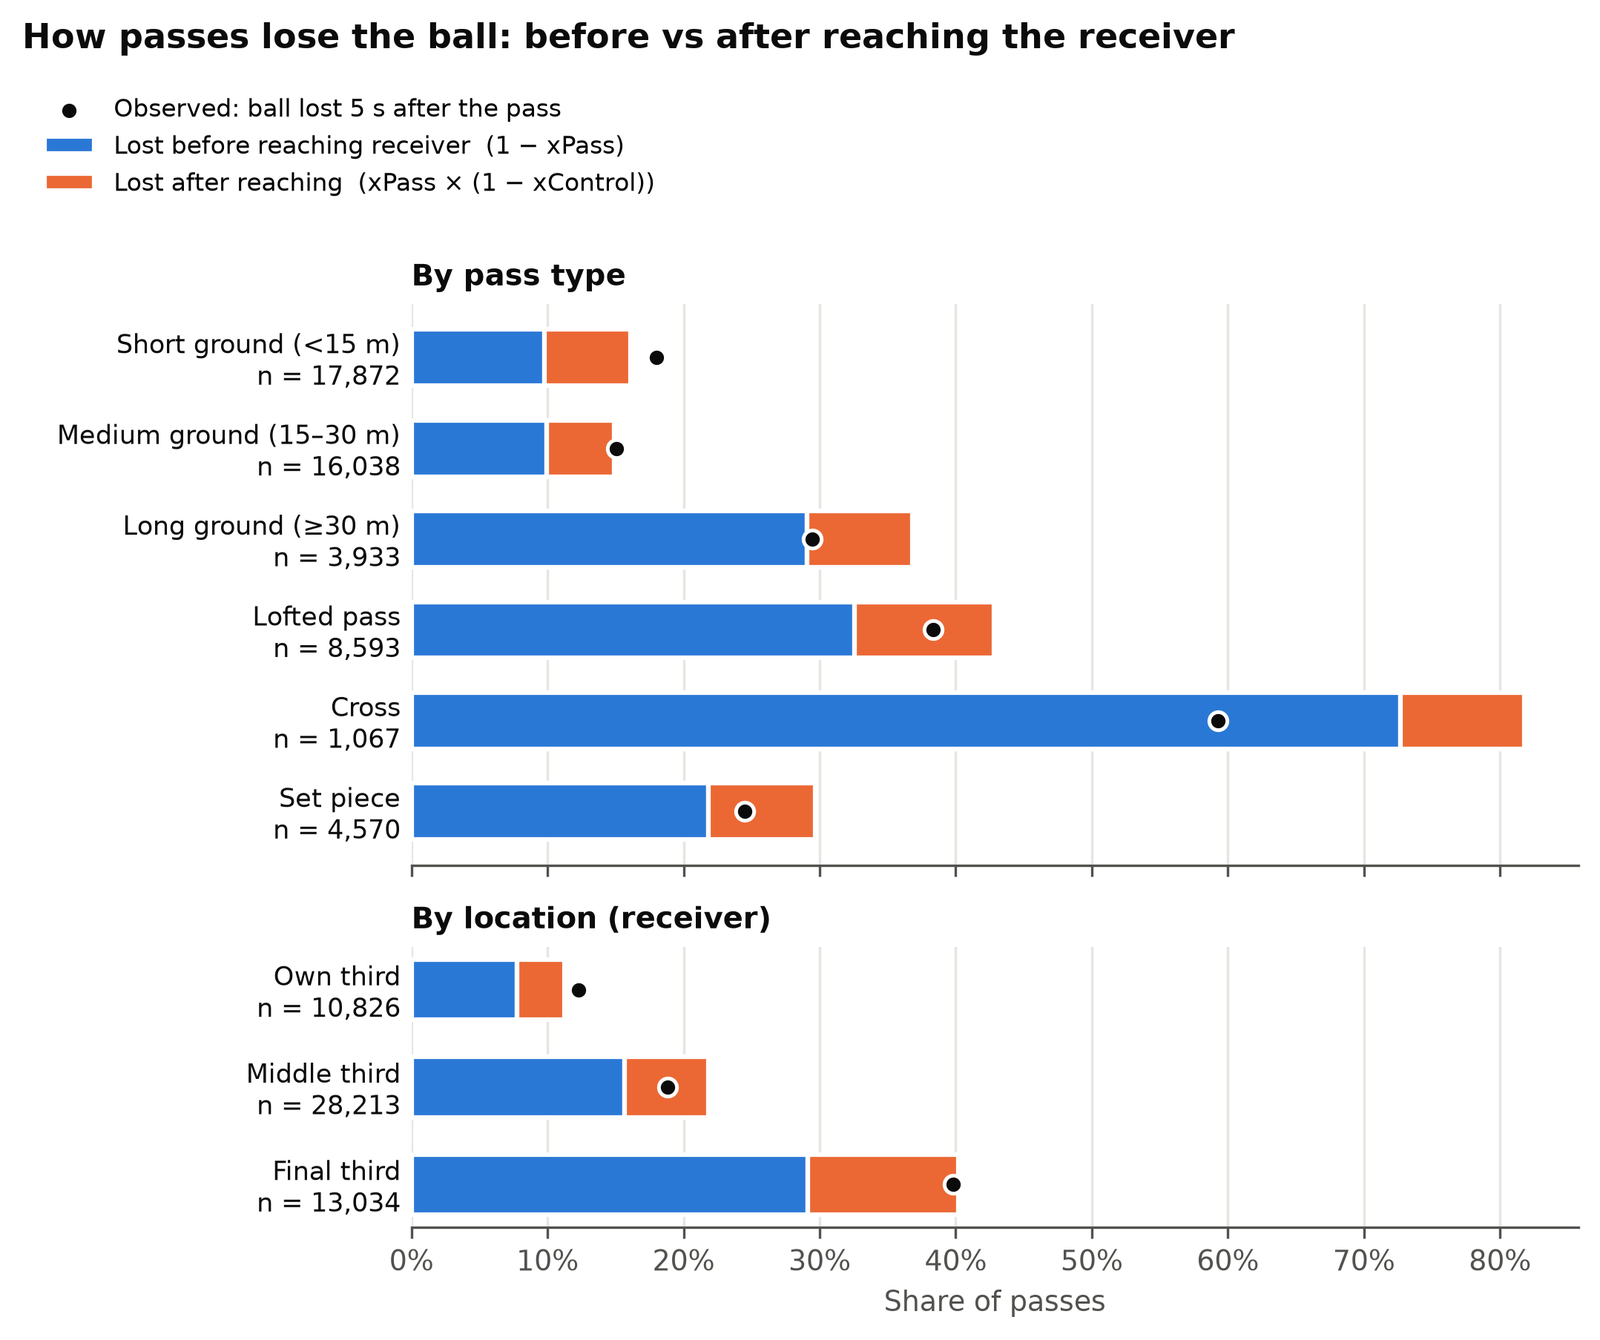
For short and medium ground passes, roughly a third or more of expected losses come after the ball has arrived.
Three things stand out:
- Long, lofted passes and crosses are lost mostly before they arrive. The blue part dominates.
- Short and medium ground passes are different. They rarely fail to arrive, so a large share of their losses comes after the ball arrives.
- In the final third, losses after reaching grow too. The ball arrives in tighter spaces, and keeping it gets harder.
For most groups, the model’s total sits close to the observed rate. Long passes, lofted passes and set pieces are overestimated by a few points, and crosses by much more, for the reason given in the caption.
5. Does the split predict better?
A model trained directly on the outcome predicts better than the split (+0.018 AUC over xSP at 3 seconds); the split’s value is in explaining where the ball is lost, not in predicting it. I compared three ways of predicting whether the team still has the ball 3 or 5 seconds after the pass: xPass alone, xSP, and a model trained directly on that outcome using the same features.
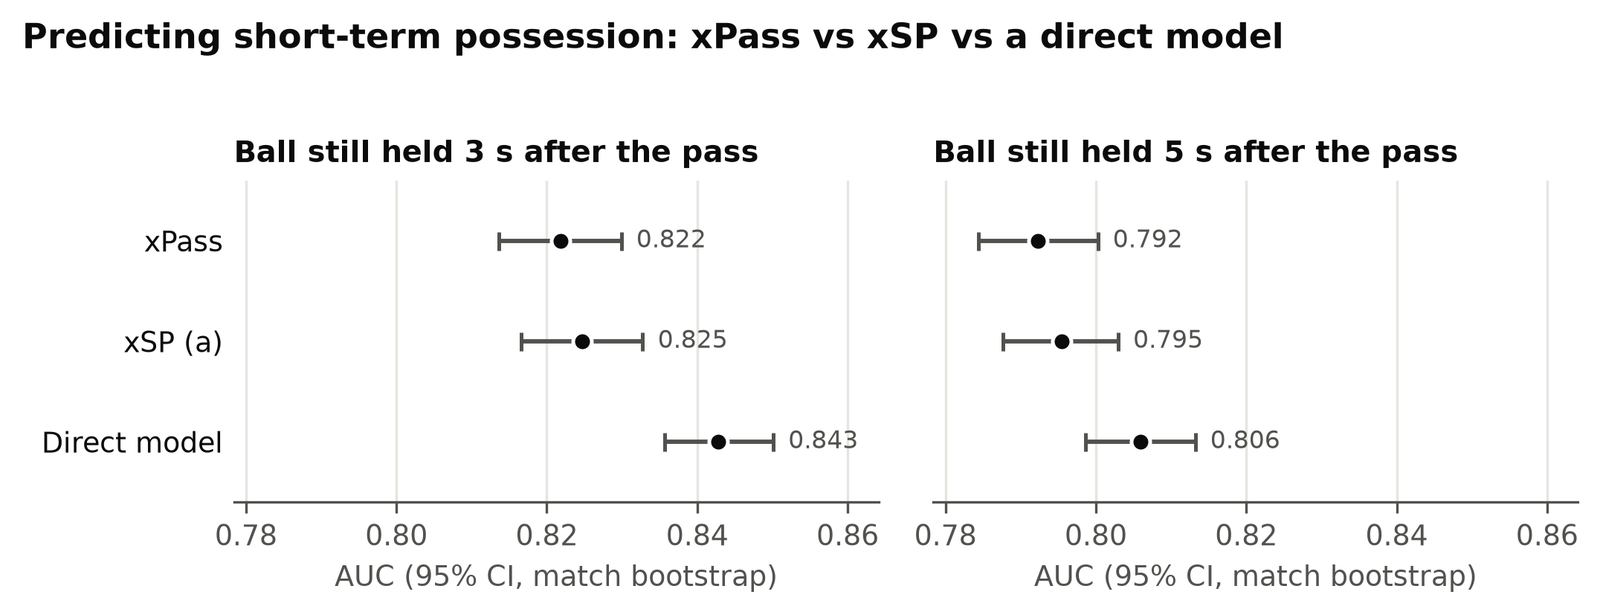
xSP improves on xPass, but only slightly (AUC +0.003). With the stricter definition of keeping the ball, it no longer beats xPass at 3 seconds.
What the split adds is an explanation: the direct model can say how risky a pass is, but not whether the risk lies in getting the ball there or in keeping it once it arrives. That distinction may be more useful to an analyst, and it is the reason to keep the two parts separate.
6. What the model can’t see
On receptions that are already a duel, the model’s AUC is 0.51, no better than chance, against 0.84 on ordinary receptions. (This is xControl, which sees only the moment the pass is played; the 0.85 in Section 3 is the first-touch model, which sees the moment of reception.) Some receptions are already a duel when the ball arrives: 1,655 in this data. A quarter of them end in a lost ball by the main definition, and half by the stricter one.
The model can’t tell which. These duels are also where you would expect keeping the ball to matter most, for long balls and crosses in particular. The likely reason is that the tracking data has positions and speeds but not body shape, arm contact or timing of the jump, which is what decides a contested ball.
7. Summary
- The split. Even when it doesn’t improve prediction, the split changes the picture: for short passes, a sizeable share of the risk sits after the ball arrives.
- Comparison with a direct model. A decomposed metric should be checked against the simplest model of the same outcome. Here it lost, and that limits what I can claim for it.
- Contested receptions. They are frequent, costly, and invisible to position-and-speed features.
Limits. One tournament, 49 matches with tracking. The receiver’s body orientation is only approximated, and agrees moderately with PFF’s own labels (κ = 0.40). I don’t report player rankings.
Data
PFF FC open 2022 World Cup data (tracking for 49 matches, events for 64). Models: gradient-boosted trees (LightGBM) and logistic regression, with match-grouped cross-validation. All intervals are match-level bootstrap.
References
- Spearman, W. et al. (2017). Physics-Based Modeling of Pass Probabilities in Soccer. MIT Sloan Sports Analytics Conference.
- Power, P. et al. (2017). Not All Passes Are Created Equal: Objectively Measuring the Risk and Reward of Passes in Soccer from Tracking Data. KDD.